Snapshots


If you have nice rendering using the flows methodology, send it to us and we will add it to the gallery.
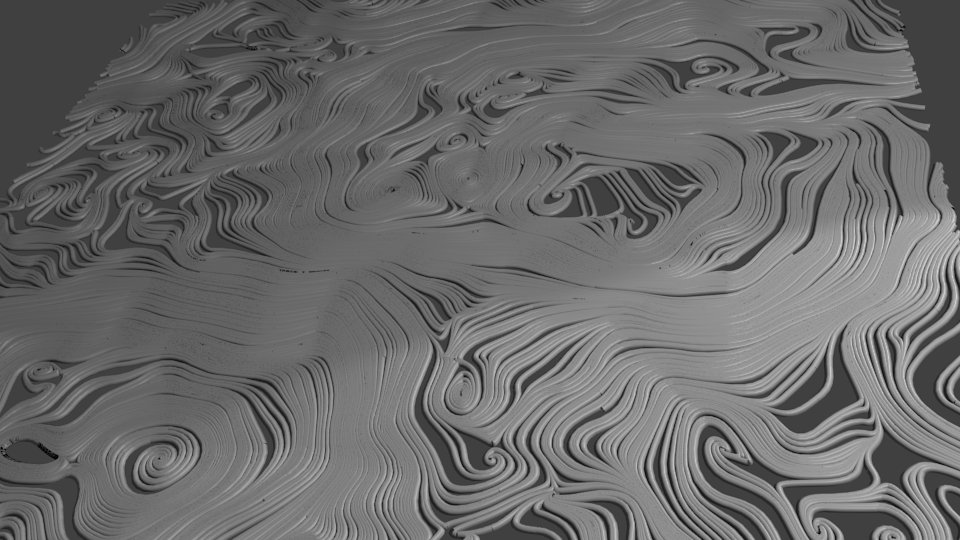
2D representation rendered using Blender3D
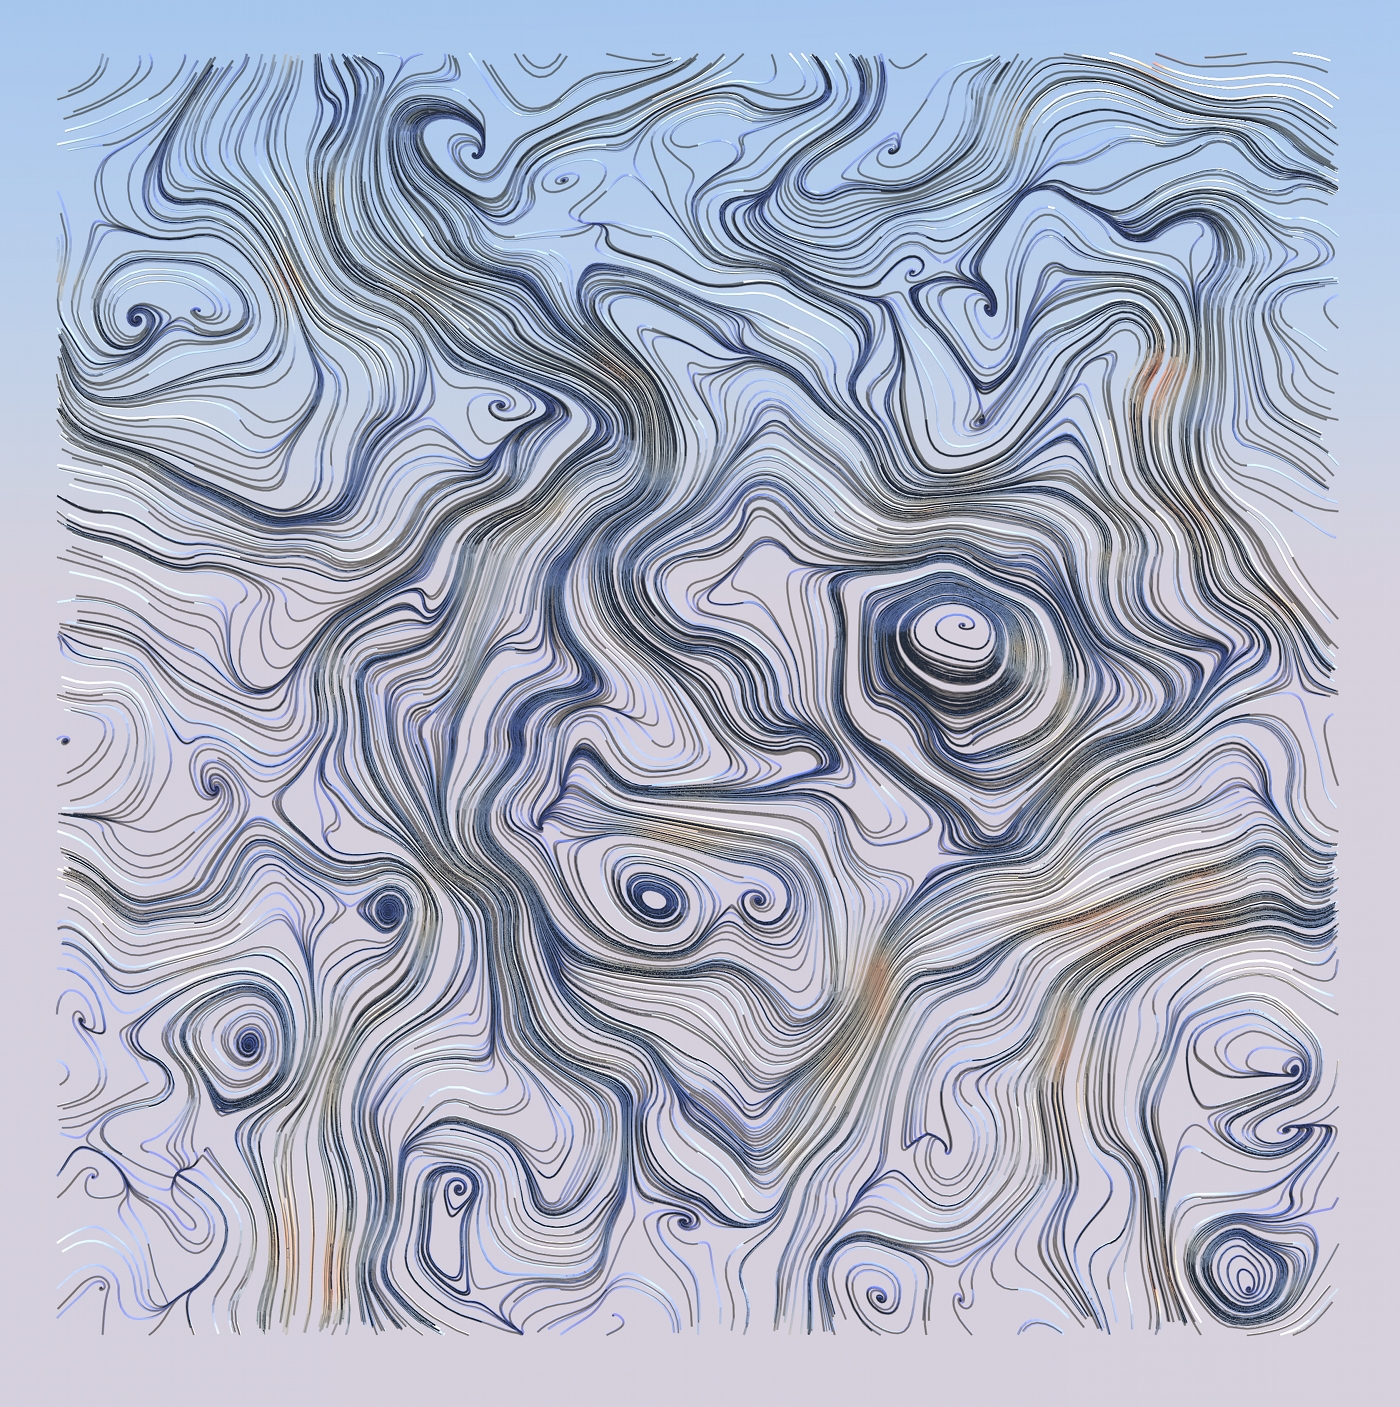
2D representation rendered and coloured using Blender3D
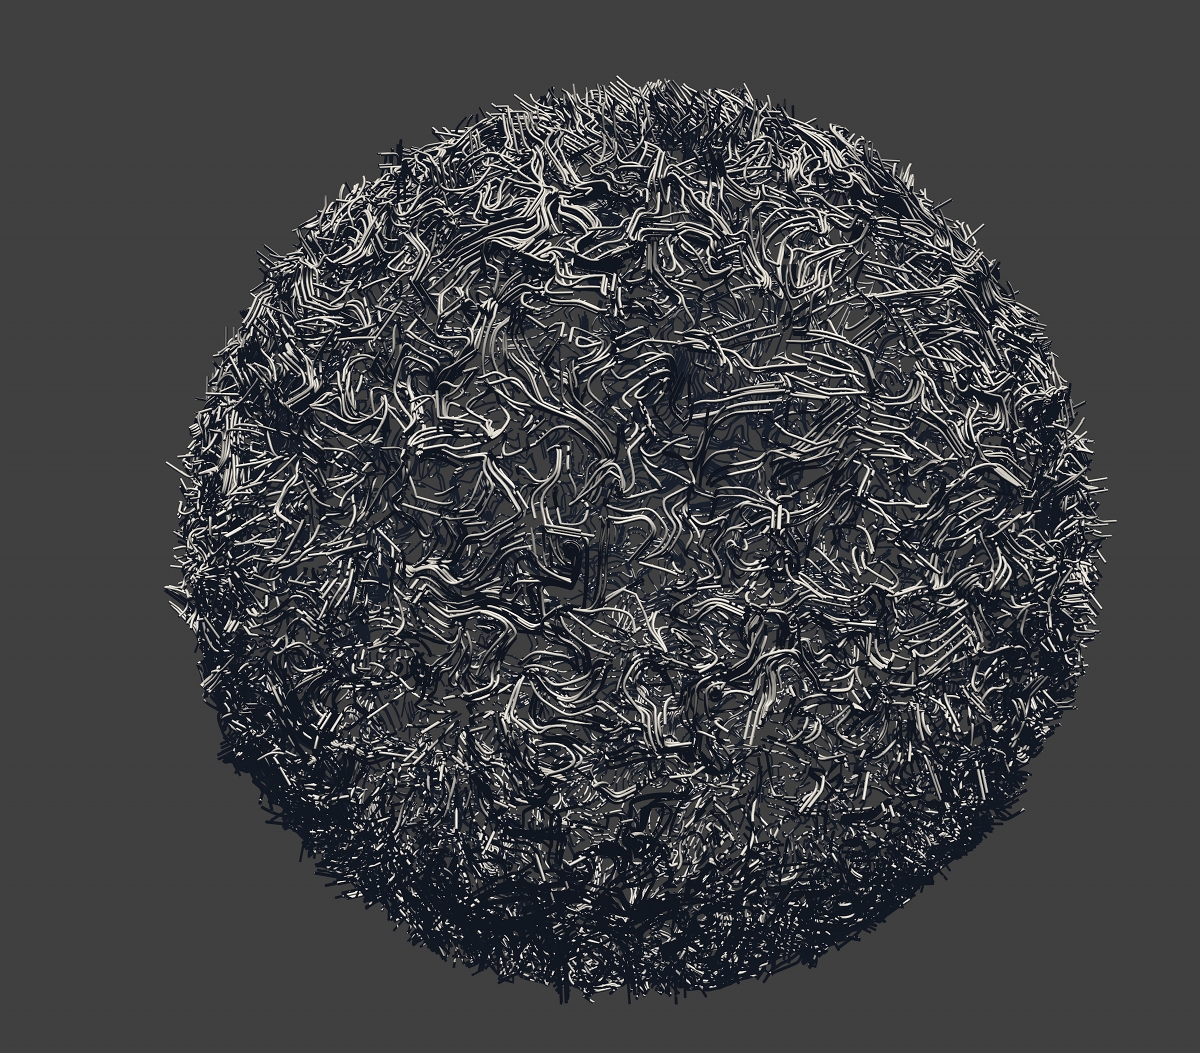
3D representation rendered using Blender3D
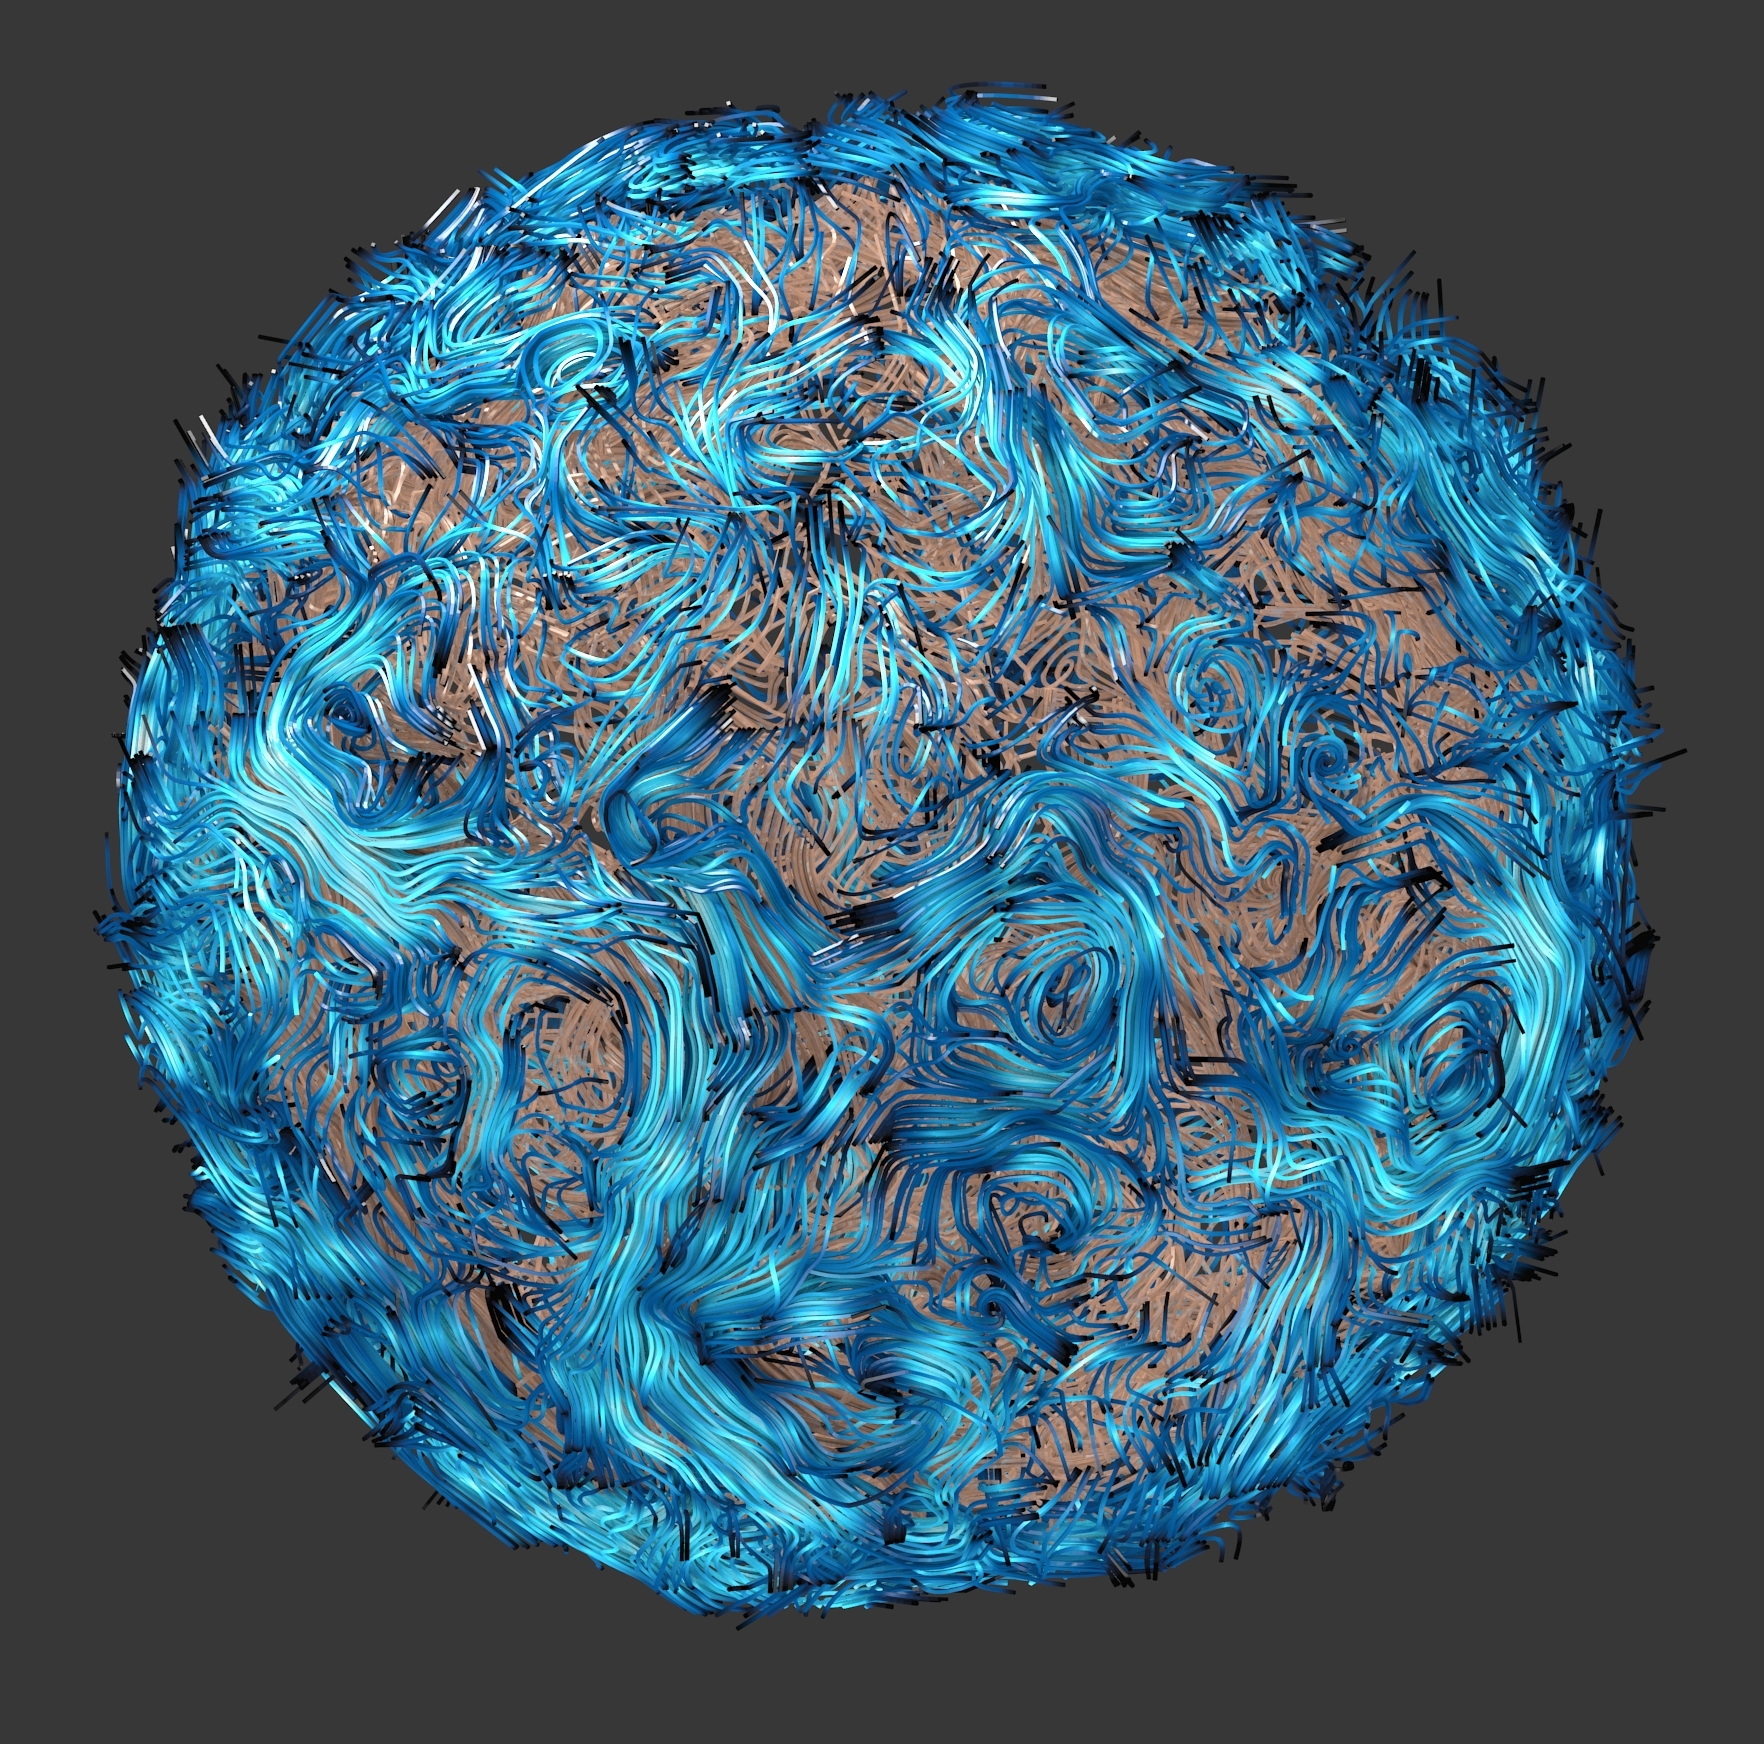
3D representation rendered and colored using Blender3D
Planar membrane rendered with Blender3D. You can download the blender file here.
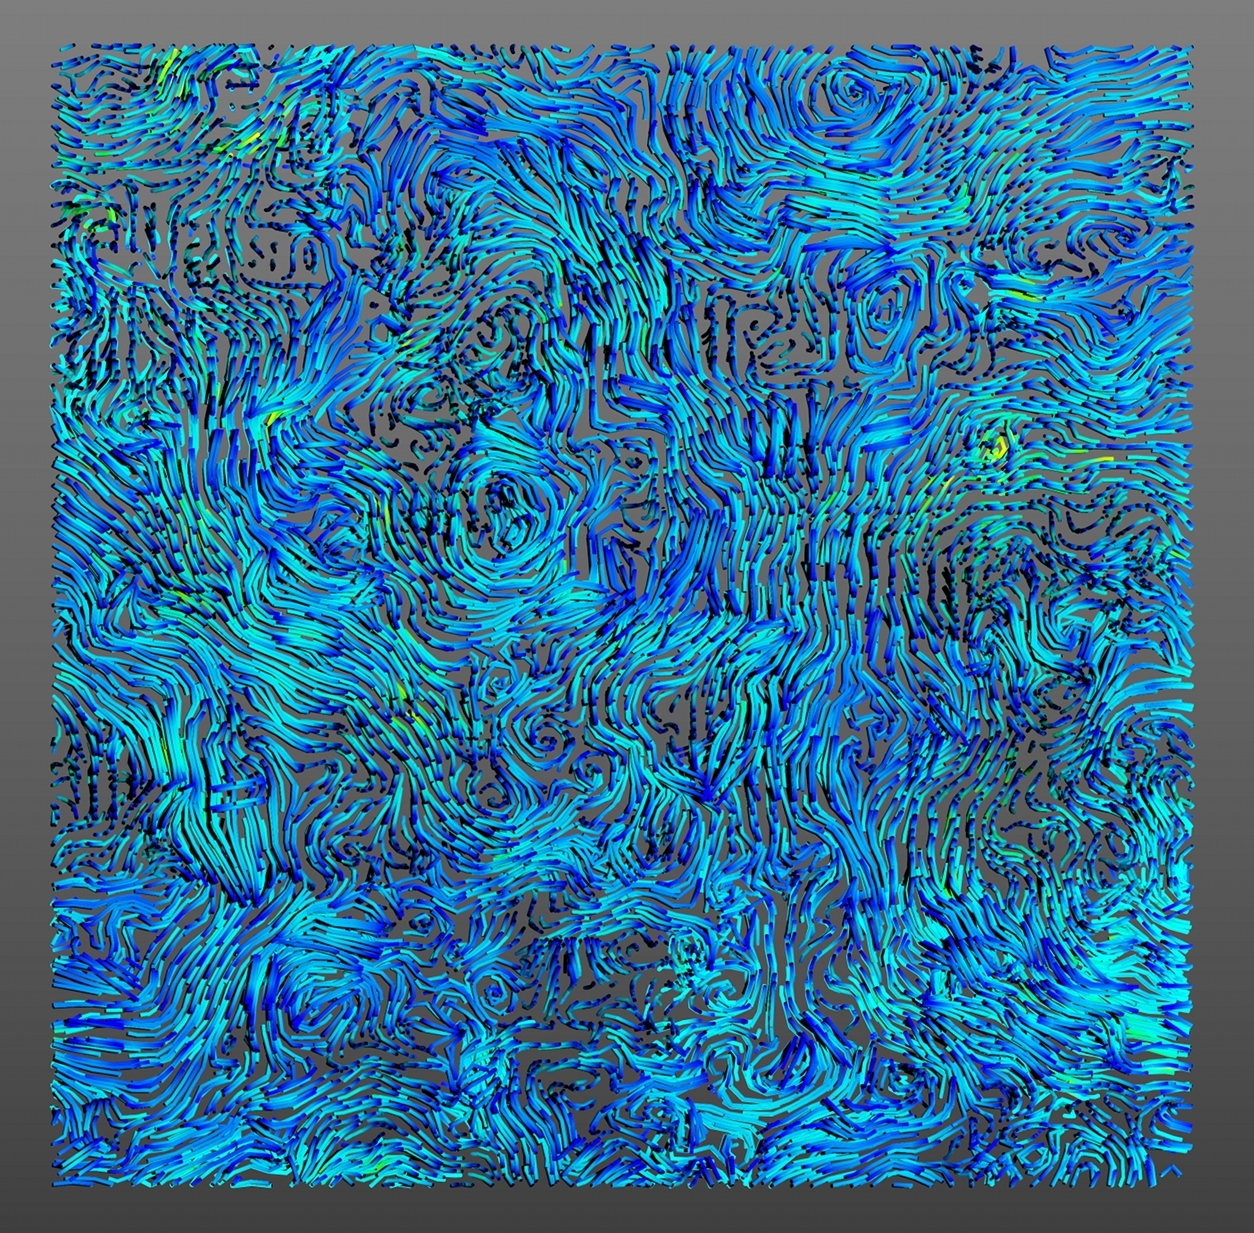
Planar membrane rendered with Blender3D. More info see here.
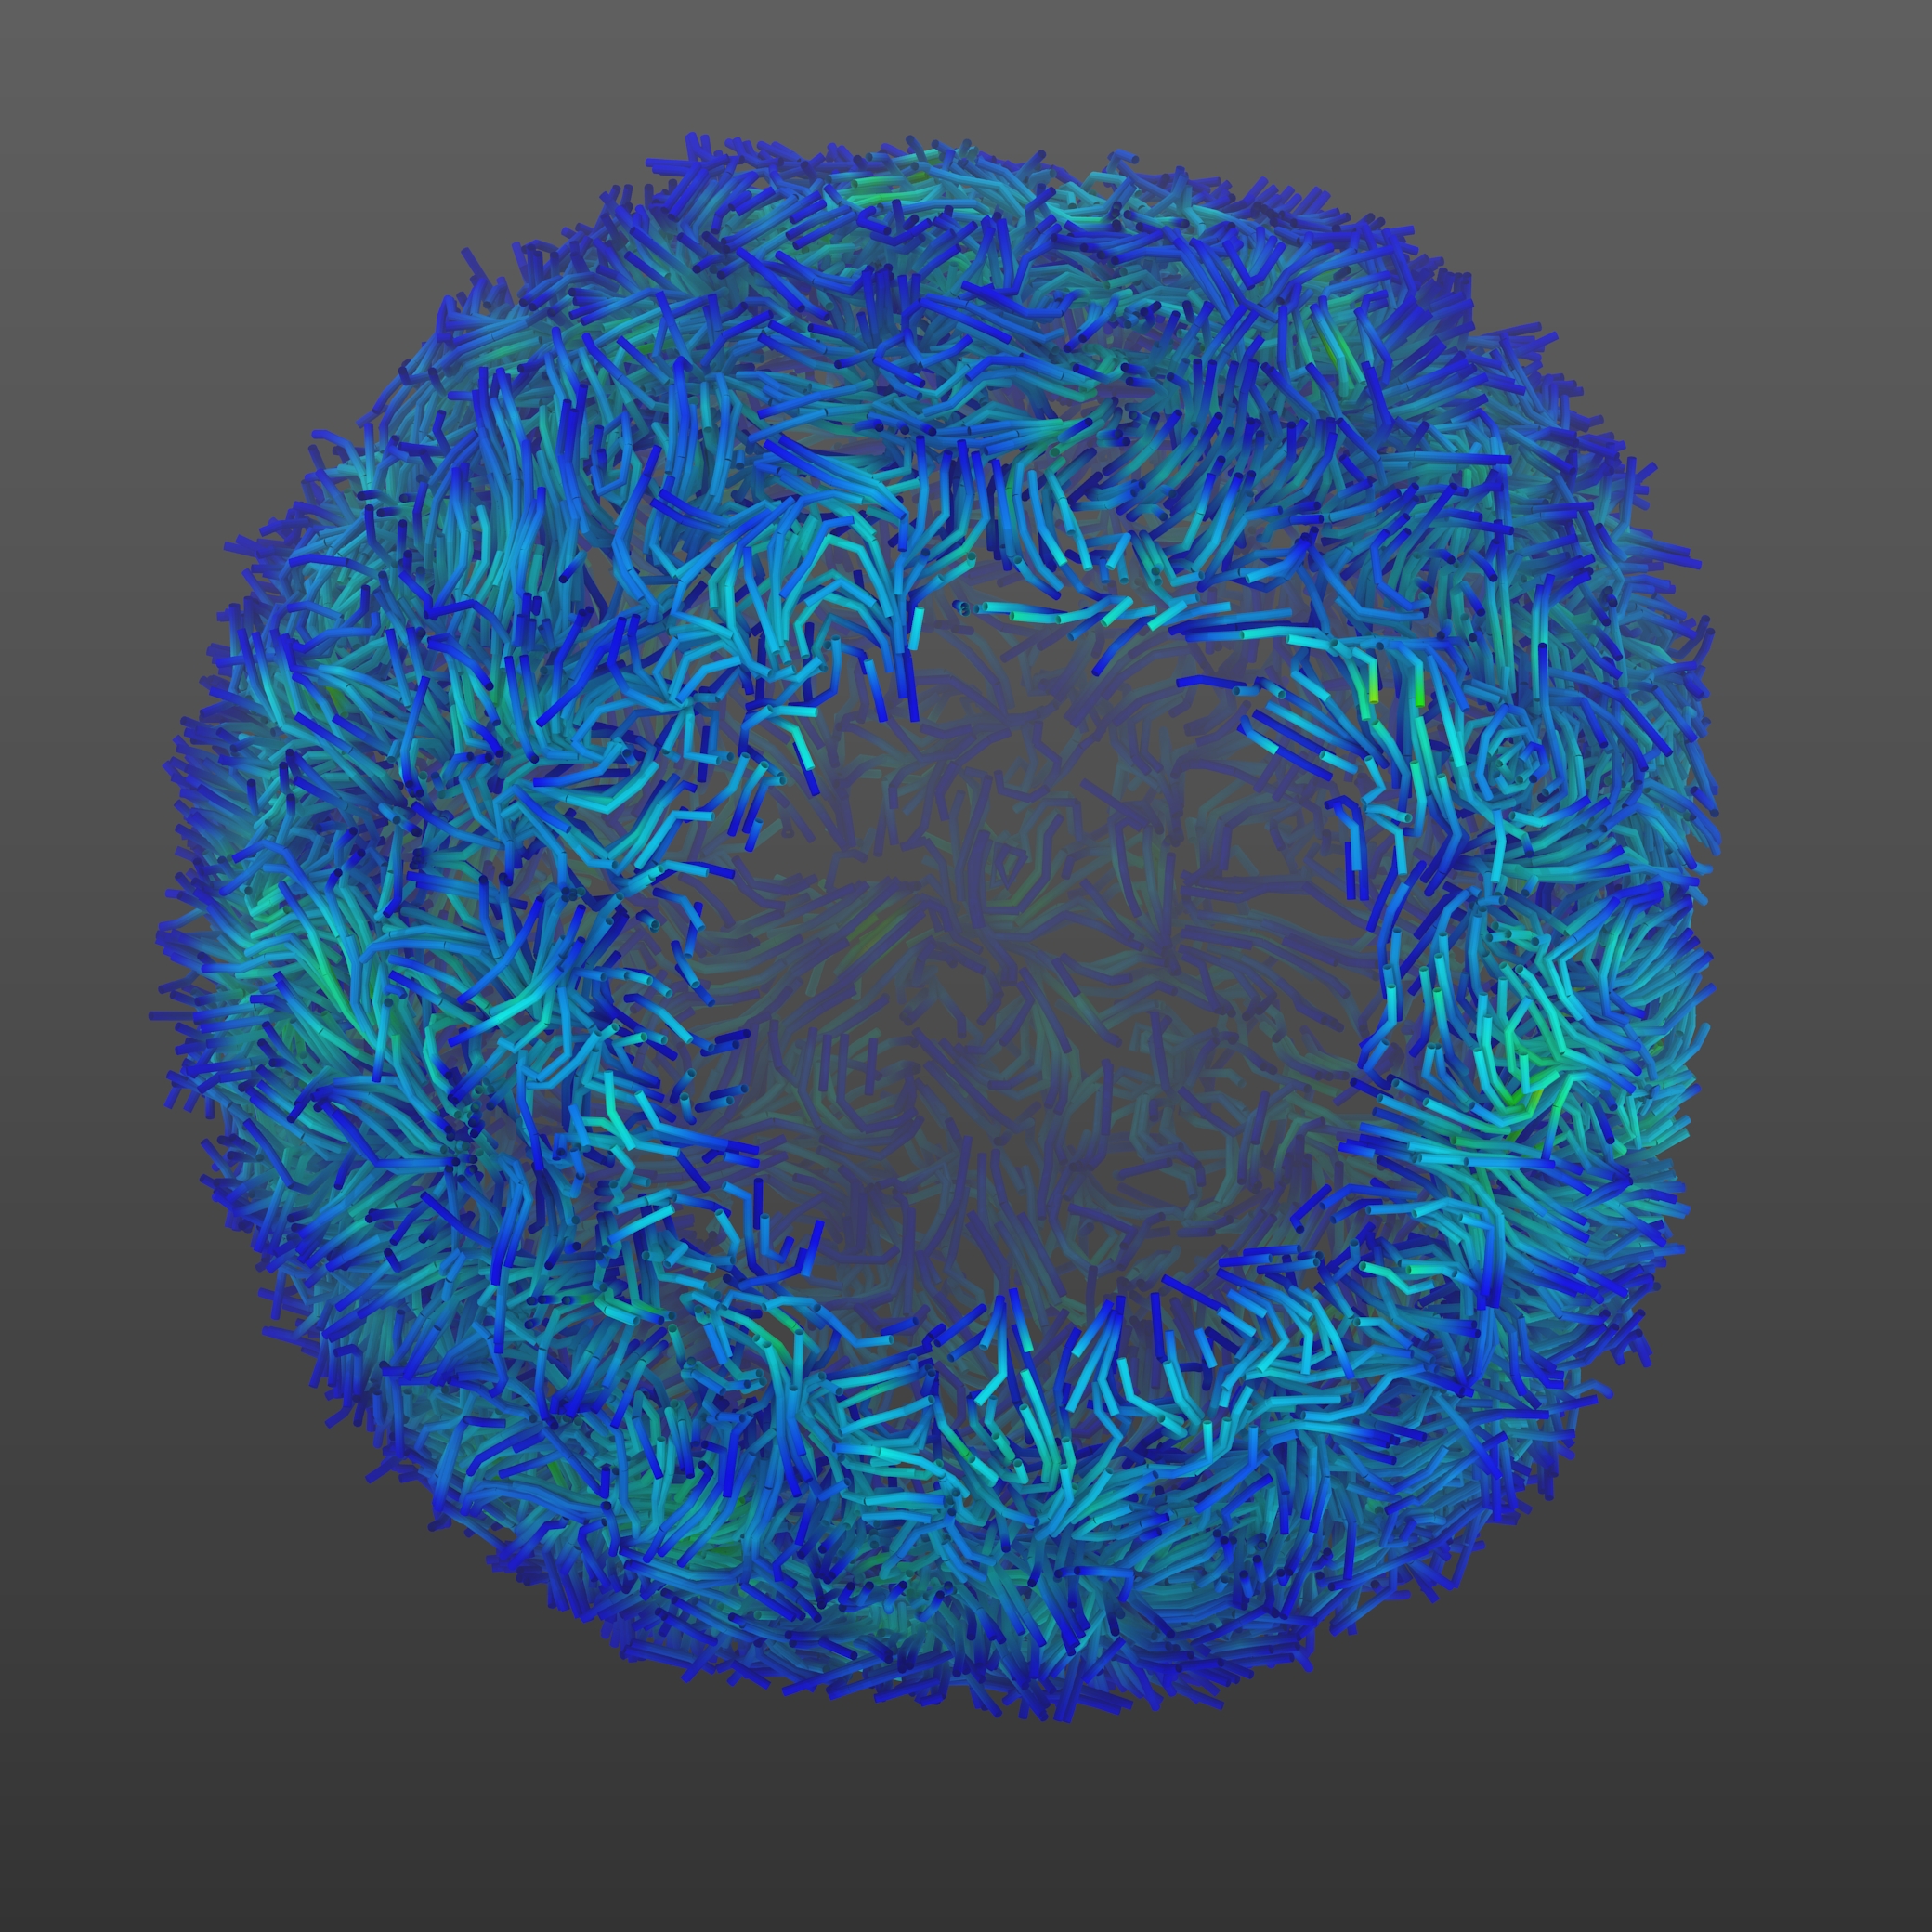
Vesicle rendered with Blender3D.

Movies


2D visualization of the upper leaflet of a planar membrane system. This model mimics a large patch of a crowded bacterial membrane. The initial system size was 1180 x 1180 x 104 ų and contained 37,680 lipids (1:3 POPG to POPE) and 256 OmpA proteins. This visualization enables display of both linear and circular nanometer-scale movements of lipids. This video was made with the MDAnalysis Module (see here). You can also see this video on the Vimeo website.


Streamline visualization coupled with height map for the planar membrane. The colours represent the vertical z values of the membrane. This representation highlights the undulations of the membrane in the z direction. High displacement parts of the streamlines are coloured in white. This video was made with the MDAnalysis Module (see here). You can also see this video on the Vimeo website.


3D streamline visualization of the vesicle outer leaflet. This vesicle has a lipid composition matching the experimentally-determined influenza A lipidome. The inner leaflet contains POPS, DOPX (ether-linked DOPE) and DOPE with an approximate 3:2:1 ratio, while the outer leaflet contains sphingomyelin (SM) molecules (with saturated C16 chains). Cholesterol (CHOL) molecules were distributed between the two leaflets and comprise >50% of all lipid molecules in the vesicle. This video was made with the VMD Plugin (see here). You can also see this video on the Vimeo website.